

Why Most Magento 2 Speed Optimization Guides Miss the Point
Every "speed up Magento 2" article tells you the same thing: install a caching extension, enable flat catalog, merge your CSS. That advice is not wrong, but it misses something fundamental. If the server underneath your store is misconfigured, no extension on earth will get you to sub-2-second load times.
We have tuned server configurations for Magento stores for well over a decade. The pattern is always the same. A store owner spends months optimizing code, installing performance extensions, and compressing images. The site is still slow. The problem was never the code. It was the server.
This guide covers the server-side optimizations that code-level fixes cannot replace. These are the changes that happen below your Magento admin panel, in config files that most developers never touch.

Why Magento 2 Is Slow by Default
Magento 2 is not inherently a slow platform. It is a complex platform running on default configurations that were designed for compatibility, not performance.
Here is what happens on every uncached Magento 2 page load:
The PHP execution chain. Magento bootstraps its entire dependency injection framework, loads hundreds of PHP classes, and builds a full object graph before generating a single byte of HTML. A typical product page executes 200-400 database queries. On a server with default PHP-FPM settings and no OPcache tuning, this takes 3-8 seconds.
The database bottleneck. Magento's EAV (Entity-Attribute-Value) schema is powerful for flexibility but punishing for performance. Loading a single product can join 10+ tables. Multiply that by category pages with 40 products, and you understand why database configuration matters more for Magento than almost any other PHP application.
The caching gap. Out of the box, Magento uses file-based caching. This means every cache read and write hits the filesystem. On a busy store, that translates to thousands of disk I/O operations per second fighting for the same resources as your database and PHP processes.
The frontend payload. The default Luma theme ships with RequireJS, KnockoutJS, jQuery, and a mountain of JavaScript modules. An unoptimized Magento storefront can push 2-4 MB of JavaScript to the browser before a single product image loads.
The good news: every one of these bottlenecks has a server-level solution.
Varnish: The Single Biggest Performance Win
If you make one change to your Magento server, make it Varnish. Nothing else comes close for raw speed improvement.
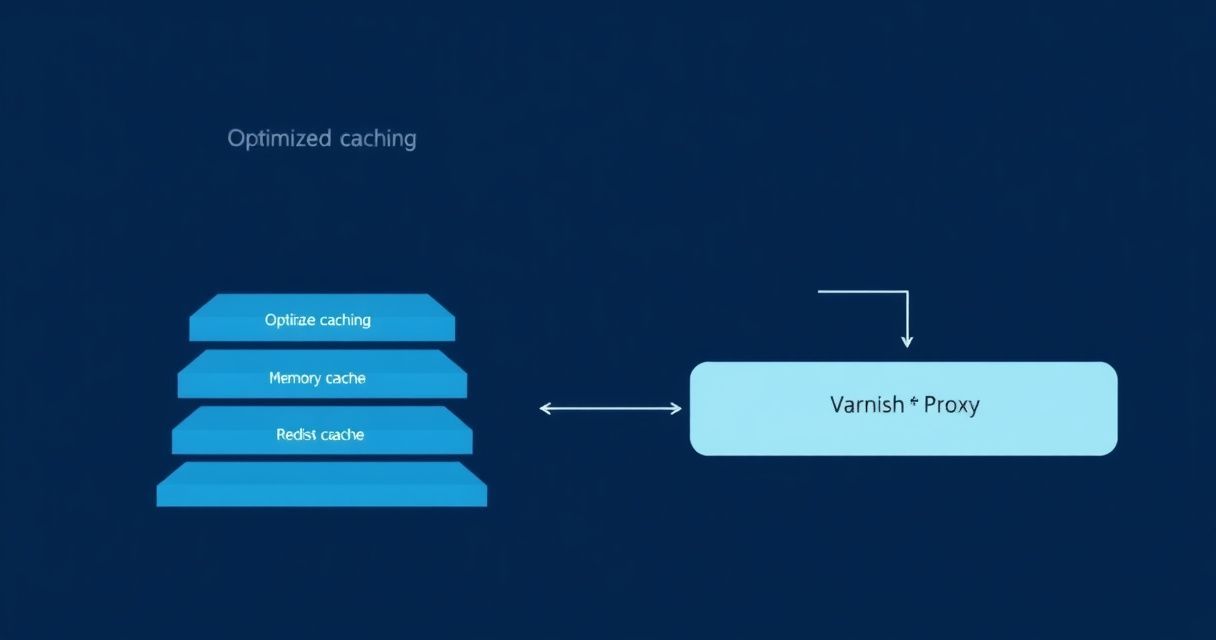
Varnish is a reverse proxy that sits in front of your web server and serves cached pages directly from memory. A page that takes 3 seconds to generate through PHP takes 10-50 milliseconds through Varnish. That is not a typo. We routinely see 50-100x improvement in Time to First Byte after Varnish is properly configured.
Magento 2 includes built-in Varnish support with a VCL (Varnish Configuration Language) generator. But the default VCL needs tuning for production. Here is what matters:
Varnish VCL Essentials for Magento
Your Magento-generated VCL should include these critical adjustments:
# Increase cache size - default is far too small for Magento
# Start with 2GB, scale up for large catalogs
# Launch with: varnishd -s malloc,2G

sub vcl_recv {
    # Normalize Accept-Encoding to improve hit rate
    if (req.http.Accept-Encoding) {
        if (req.http.Accept-Encoding ~ "gzip") {
            set req.http.Accept-Encoding = "gzip";
        } elsif (req.http.Accept-Encoding ~ "deflate") {
            set req.http.Accept-Encoding = "deflate";
        } else {
            unset req.http.Accept-Encoding;
        }
    }

    # Strip tracking parameters that fragment the cache
    if (req.url ~ "(\?|&)(gclid|utm_[a-z]+|fbclid|mc_[a-z]+)=") {
        set req.url = regsuball(req.url, "(gclid|utm_[a-z]+|fbclid|mc_[a-z]+)=[^&]+&?", "");
        set req.url = regsub(req.url, "[\?&]+$", "");
    }
}

sub vcl_backend_response {
    # Set minimum TTL for static assets
    if (bereq.url ~ "\.(css|js|jpg|jpeg|png|gif|webp|svg|woff2?)$") {
        set beresp.ttl = 7d;
        unset beresp.http.Set-Cookie;
    }

    # Grace mode: serve stale content while refreshing
    set beresp.grace = 6h;
}
The key numbers to monitor: your Varnish hit rate should be above 85% for a well-configured Magento store. Below 70% means something is fragmenting your cache, usually cookies or query parameters that should be stripped.
Common Varnish Mistakes
Not excluding the checkout and cart. These pages must bypass Varnish entirely. Magento's generated VCL handles this, but custom modules that set cookies on every page request will destroy your hit rate.
Insufficient memory allocation. A Magento store with 10,000 SKUs and multiple store views needs 2-4 GB of Varnish cache minimum. Under-allocating means constant evictions and lower hit rates.
Ignoring health checks. Configure Varnish health probes to detect when your backend PHP is overloaded, so it can serve grace content instead of passing slow requests through.
Redis: Sessions and Cache in Memory
If Varnish handles the front door, Redis handles everything behind it. Magento 2 supports Redis for three distinct purposes, and you should use it for all three.
Redis Configuration for Magento
Use separate Redis databases (or separate Redis instances for high-traffic stores) for each purpose:
// app/etc/env.php

// Redis for default cache (db 0)
'cache' => [
    'frontend' => [
        'default' => [
            'backend' => 'Magento\Framework\Cache\Backend\Redis',
            'backend_options' => [
                'server' => '/var/run/redis/redis.sock',
                'database' => '0',
                'compress_data' => '1',
                'compression_lib' => 'lz4'
            ]
        ],
        // Redis for full page cache (db 1)
        'page_cache' => [
            'backend' => 'Magento\Framework\Cache\Backend\Redis',
            'backend_options' => [
                'server' => '/var/run/redis/redis.sock',
                'database' => '1',
                'compress_data' => '0'
            ]
        ]
    ]
],

// Redis for sessions (db 2)
'session' => [
    'save' => 'redis',
    'redis' => [
        'host' => '/var/run/redis/redis.sock',
        'port' => '0',
        'database' => '2',
        'max_concurrency' => '10',
        'break_after_frontend' => '5',
        'break_after_adminhtml' => '30',
        'bot_lifetime' => '7200'
    ]
]
Notice the Unix socket connection instead of TCP. On the same server, this eliminates network overhead and reduces latency by 20-30% compared to connecting via 127.0.0.1:6379.
The bot_lifetime setting is often overlooked. Bots and crawlers create sessions that waste memory. Setting a shorter lifetime for bot sessions (2 hours instead of the default) can reclaim significant Redis memory on crawl-heavy stores.
Redis Memory Policy
Configure Redis with the allkeys-lru eviction policy and set maxmemory to a reasonable ceiling. For most Magento stores, 1-2 GB is sufficient for cache, plus another 512 MB for sessions:
# /etc/redis/redis.conf
maxmemory 2gb
maxmemory-policy allkeys-lru
Elasticsearch (or OpenSearch): Search That Does Not Kill Your Database
Magento 2.4+ requires Elasticsearch or OpenSearch. This is not optional, and it is a good thing. Every catalog search, layered navigation filter, and product listing page that hits MySQL directly instead of Elasticsearch is a missed optimization.
What matters at the server level:
Heap size. Allocate 50% of available memory to the Elasticsearch JVM heap, with an upper bound of 32 GB (above which compressed oops are disabled and performance degrades). For most Magento stores, 2-4 GB heap is the right range.
Index settings. Magento's default index configuration creates a single shard per index. For catalogs over 50,000 products, increasing to 2-3 shards improves query parallelism. More important: set refresh_interval to 30 seconds during reindexing to avoid constant segment merging.
Dedicated resources. On shared servers, Elasticsearch competes with MySQL and PHP for CPU and memory. On our managed Magento stacks, Elasticsearch always gets its own allocation. The performance difference is measurable.
PHP-FPM Tuning: Where Most Servers Fail
Default PHP-FPM configuration is designed for shared hosting with dozens of sites. Magento needs a different approach entirely.
Pool Configuration
; /etc/php/8.2/fpm/pool.d/magento.conf

[magento]
user = magento
group = magento

; Static process manager for predictable performance
pm = static
pm.max_children = 20

; Recycle workers to prevent memory leaks
pm.max_requests = 1000

; Slow log for identifying bottlenecks
request_slowlog_timeout = 5s
slowlog = /var/log/php-fpm/magento-slow.log

; Terminate requests that run too long
request_terminate_timeout = 300
Calculating pm.max_children
This is the single most impactful PHP-FPM setting, and the right value depends on your server's RAM. Here is the formula:
max_children = (Total RAM - RAM for OS - RAM for MySQL - RAM for Redis - RAM for Varnish) / Average PHP worker memoryA single Magento PHP-FPM worker typically uses 200-400 MB of memory. On a server with 32 GB RAM:
- OS and services: 2 GB
- MySQL: 12 GB (InnoDB buffer pool + overhead)
- Redis: 2 GB
- Varnish: 2 GB
- Elasticsearch: 4 GB
- Remaining for PHP: 10 GB
- At 350 MB per worker: 28 workers maximum, set to 24 for safety margin
Setting this too high causes the server to swap, which is catastrophically slow. Setting it too low means requests queue during traffic spikes. Get it right and your store handles load predictably.
OPcache Settings for Magento
OPcache stores precompiled PHP bytecode in shared memory, eliminating the need to parse PHP files on every request. These settings are tuned for Magento:
; /etc/php/8.2/conf.d/opcache.ini
opcache.enable=1
opcache.memory_consumption=512
opcache.max_accelerated_files=130000
opcache.validate_timestamps=0
opcache.save_comments=1
opcache.enable_cli=1
The critical setting is opcache.validate_timestamps=0. With this disabled, PHP never checks whether source files have changed. This means you must clear OPcache after every deployment (via php-fpm reload or opcache_reset()), but the performance gain during normal operation is substantial. Magento's codebase includes over 100,000 PHP files. Skipping stat() calls for each one adds up.
Set max_accelerated_files to at least 130,000. Magento with a few extensions easily exceeds the default of 10,000, and when OPcache runs out of file slots, it silently stops caching new files.
NVMe Storage: The Foundation Everything Runs On
Disk I/O is the silent performance killer. You can tune every service perfectly, but if your storage is slow, the entire stack suffers. Here is the reality of storage performance for Magento:
- HDD (spinning disk): 100-200 IOPS. Unusable for production Magento.
- SATA SSD: 10,000-50,000 IOPS. Acceptable for small stores.
- NVMe SSD: 200,000-500,000+ IOPS. The right choice for any serious Magento deployment.
The difference is not subtle. A Magento reindex operation that takes 45 minutes on SATA SSD completes in 8 minutes on NVMe. Database queries that depend on disk reads for cold data complete 5-10x faster. Even Redis benefits when it persists data to disk for durability.
Every server we provision for Magento uses NVMe storage exclusively. The cost difference compared to SATA SSD is marginal. The performance difference is not.
CDN and Edge Optimization
Server-side optimization gets your HTML to the visitor fast. CDN optimization gets everything else there fast.
Cloudflare Configuration for Magento
Cloudflare is our standard recommendation for Magento CDN. The configuration that matters:
Caching rules. Cache static assets aggressively (CSS, JS, images, fonts) with long TTLs. Never cache HTML through Cloudflare when Varnish is handling full page cache. Double-caching creates invalidation nightmares.
Brotli compression. Enable it. Brotli achieves 15-20% better compression than gzip for text-based assets. The decompression speed is equivalent, so there is no tradeoff. Magento's CSS and JavaScript bundles see the largest benefit.
Image optimization. If you are on a Cloudflare plan that includes Polish and WebP conversion, enable both. This offloads image optimization from your server entirely. A product image that was 500 KB as JPEG becomes 120 KB as WebP with no visible quality loss.
HTTP/2 and HTTP/3. Both should be enabled. HTTP/2 multiplexing eliminates the performance penalty of Magento's many individual CSS and JavaScript files. HTTP/3 (QUIC) improves performance on mobile networks with packet loss.
Image Optimization at the Server Level
Beyond CDN, configure your web server to serve modern image formats:
# Nginx: Serve WebP when supported
map $http_accept $webp_suffix {
    default "";
    "~*webp" ".webp";
}

location ~* ^(/media/.+)\.(jpe?g|png)$ {
    try_files $1$webp_suffix $uri =404;
    expires 1y;
    add_header Cache-Control "public, immutable";
}
This serves WebP versions of images to browsers that support it, with zero changes to Magento templates or extensions.
Database Optimization: MySQL/MariaDB for Magento
The database is Magento's backbone. Default MySQL configurations assume a general-purpose workload. Magento is not general purpose.
Critical MySQL Settings
# /etc/mysql/conf.d/magento.cnf

[mysqld]
# InnoDB buffer pool: 50-70% of total RAM dedicated to MySQL
innodb_buffer_pool_size = 12G
innodb_buffer_pool_instances = 12

# Log file size: larger = better write performance, slower recovery
innodb_log_file_size = 2G
innodb_log_buffer_size = 64M

# Flush behavior: 2 = flush once per second (best performance)
# Use 1 for maximum durability if data loss on crash is unacceptable
innodb_flush_log_at_trx_commit = 2
innodb_flush_method = O_DIRECT

# Thread handling
innodb_read_io_threads = 8
innodb_write_io_threads = 8
innodb_io_capacity = 4000
innodb_io_capacity_max = 8000

# Temp tables
tmp_table_size = 256M
max_heap_table_size = 256M

# Query cache: DISABLE for Magento 2
# Magento's frequent writes cause constant invalidation
query_cache_type = 0
query_cache_size = 0

# Connection handling
max_connections = 500
thread_cache_size = 64
table_open_cache = 8000
The most important setting is innodb_buffer_pool_size. This determines how much of your database can be held in memory. When the buffer pool is large enough to hold your entire active dataset, reads are served from memory instead of disk. For a Magento store with a 5 GB database, a 12 GB buffer pool means the entire dataset plus indexes fit comfortably in RAM.
Note the disabled query cache. This is counterintuitive, but the MySQL query cache is a single-threaded bottleneck. Magento's write-heavy operations (cart updates, session writes, indexing) cause constant cache invalidation. Disabling it actually improves performance. MySQL 8.0 removed the query cache entirely for this reason.
Regular Maintenance
Schedule these operations during low-traffic windows:
OPTIMIZE TABLEfor heavily written tables (catalog_product_entity,sales_order,quote)- InnoDB defragmentation for tables with high delete rates
- Binary log purging to reclaim disk space
Monitoring: What to Watch and Why
Optimization without monitoring is guesswork. These are the metrics that matter for Magento performance:
Time to First Byte (TTFB). This measures your server's response time. Target: under 200 ms for cached pages (Varnish hit), under 800 ms for uncached. If TTFB exceeds 1 second consistently, the problem is server-side. Period.
First Contentful Paint (FCP). The time until the browser renders the first visible content. For Magento, this is heavily influenced by render-blocking CSS and JavaScript. Target: under 1.5 seconds.
Largest Contentful Paint (LCP). Google's primary speed metric for ranking. Usually the hero image or product image on Magento pages. Target: under 2.5 seconds. Sub-2 seconds is achievable with proper server configuration plus CDN.
Database query time. Enable the MySQL slow query log with a 1-second threshold. Any query taking longer than 1 second in production is a problem. The most common offenders in Magento: catalog price indexing, EAV attribute queries on large catalogs, and unoptimized custom module queries.
PHP-FPM pool status. Monitor active processes, idle processes, and the listen queue. If the listen queue is regularly above zero, you do not have enough PHP workers. If idle processes are consistently high, you have allocated too many.
# Check PHP-FPM pool status
curl -s http://localhost/fpm-status | grep -E "active|idle|listen queue"
Redis memory usage. If Redis is using more than 80% of its configured maxmemory, you are heading toward eviction. Monitor evicted_keys in Redis INFO output. Any value above zero means your cache is thrashing.
The Hyva Factor
No server-side optimization guide for Magento is complete without mentioning Hyva. Hyva is a replacement frontend theme that removes the legacy JavaScript stack (RequireJS, KnockoutJS, jQuery) and replaces it with Alpine.js and Tailwind CSS.
The impact on performance metrics is dramatic. Stores that migrated from Luma to Hyva typically see:
- JavaScript payload drops from 2-4 MB to under 200 KB
- LCP improves by 40-60%
- FCP drops to under 1 second
- Core Web Vitals move from failing to passing without any server changes
This matters from a server perspective because Hyva reduces the number of HTTP requests, reduces bandwidth consumption, and reduces the computational load on Varnish (fewer assets to cache and serve). A Magento store on Hyva with a properly configured server stack is competitive with Shopify and BigCommerce on raw speed metrics.
Hyva is a paid theme, and the migration requires frontend development work. But for stores where Core Web Vitals scores are critical for SEO and conversion, the investment pays for itself.
When to Upgrade Your Server vs. Optimize Code
After years of tuning Magento environments, here is the decision framework we use:
Upgrade your server when:
- PHP-FPM workers are consistently maxed out during normal traffic
- InnoDB buffer pool hit rate is below 99% (your database does not fit in RAM)
- Varnish is evicting frequently despite proper configuration
- NVMe IOPS utilization exceeds 70% during peak hours
- You are running Magento, MySQL, Redis, Elasticsearch, and Varnish on a single server with less than 32 GB RAM
Optimize code when:
- Slow query log shows specific queries taking seconds
- New Relic or Blackfire profiling points to specific PHP functions
- Third-party extensions are adding unnecessary database queries to every page load
- The frontend payload size is excessive (common with Luma theme)
- Cron jobs are running during peak hours and competing for resources
Do both when:
- Your store has grown past 50,000 SKUs or 10,000 daily visitors on existing hardware
- You are planning for a seasonal traffic spike (Black Friday, holiday sales)
- Your current TTFB is above 500 ms for cached pages
The most common mistake we see is throwing more server resources at a problem that is actually a code issue, or spending months optimizing code when the server was the bottleneck all along. Proper monitoring tells you which side needs attention.
The Complete Stack
For a Magento 2 store targeting sub-2-second load times, here is the full server stack we deploy:
| Layer | Technology | Purpose |
|---|---|---|
| Edge | Cloudflare | CDN, DDoS protection, Brotli, HTTP/3 |
| Cache | Varnish 7.x | Full page cache, 50-100x faster than PHP |
| Web server | Nginx | Reverse proxy, static files, SSL termination |
| Application | PHP 8.2+ FPM | Static pool, OPcache, JIT compilation |
| Cache backend | Redis 7.x | Session storage, application cache |
| Search | OpenSearch 2.x | Catalog search, layered navigation |
| Database | MariaDB 10.11 | Tuned InnoDB, NVMe storage |
| Storage | NVMe SSD | 200,000+ IOPS for all services |
Each layer is configured specifically for Magento's workload patterns. The result: sub-200 ms TTFB on cached pages, sub-800 ms on uncached, and Largest Contentful Paint under 2 seconds with proper frontend optimization.
Get a Magento Speed Review
Reading about optimization is one thing. Knowing exactly what is slowing down your specific store is another.
Ask us for a Magento speed review: our team analyzes your current server configuration, identifies the specific bottlenecks affecting your store, and provides a prioritized action plan. No generic recommendations. We look at your actual Varnish hit rates, PHP-FPM utilization, MySQL query performance, and Redis memory patterns.
Whether you are on our Magento hosting or someone else's, the audit gives you a clear picture of what is holding your store back and what to fix first.
Request a Magento speed review and find out what is standing between your store and sub-2-second load times.